Basic Data Management
Reproducible Research Data and Project Management in R
Dr Anna Krystallli
R-RSE
https://acce-rrresearch.netlify.app/
Start at the beginning
Plan your Research Data Management
- Start early. Make an RDM plan before collecting data.
- Anticipate data products as part of your thesis outputs
- Think about what technologies to use
Own your data
Take initiative & responsibility. Think long term.
Act as though every short term study will become a long term one @tomjwebb. Needs to be reproducible in 3, 20, 100 yrs
— Oceans Initiative (@oceansresearch) January 16, 2015
Act as though every short term study will become a long term one @tomjwebb. Needs to be reproducible in 3, 20, 100 yrs
— oceans initiative (@oceansresearch) January 16, 2015
Data management
Spreadsheets
extreme but in many ways defendable
@tomjwebb stay away from excel at all costs?
— Timothée Poisot (@tpoi) January 16, 2015
excel: read/entry only
@tomjwebb @tpoi excel is fine for data entry. Just save in plain text format like csv. Some additional tips: pic.twitter.com/8fUv9PyVjC
— Jaime Ashander (@jaimedash) January 16, 2015
@jaimedash just don’t let excel anywhere near dates or times. @tomjwebb @tpoi @larysar
— Dave Harris (@davidjayharris) January 16, 2015
Databases: more robust
Stronger quality control features. Advisable for multiple contributors
@tomjwebb databases? @swcarpentry has a good course on SQLite
— Timothée Poisot (@tpoi) January 16, 2015
@tomjwebb @tpoi if the data are moderately complex, or involve multiple people, best to set up a database with well designed entry form 1/2
— Luca Borger (@lucaborger) January 16, 2015
Databases: benefits
@tomjwebb Entering via a database management system (e.g., Access, Filemaker) can make entry easier & help prevent data entry errors @tpoi
— Ethan White (@ethanwhite) January 16, 2015
@ethanwhite +1 Enforcing data types, options from selection etc, just some useful things a DB gives you, if you turn them on @tomjwebb @tpoi
— Gavin Simpson (@ucfagls) January 16, 2015
@tomjwebb it also prevents a lot of different bad practices. It is possible to do some of this in Excel. @tpoi
— Ethan White (@ethanwhite) January 16, 2015
Have a look at the Data Carpentry SQL for Ecology lesson
Data formats
Data formats
.csv: comma separated values..tsv: tab separated values..txt: no formatting specified.
@tomjwebb It has to be interoperability/openness - can I read your data with whatever I use, without having to convert it?
— Paul Swaddle (@paul_swaddle) January 16, 2015
more unusual formats will need instructions on use.
Ensure data is machine readable
bad
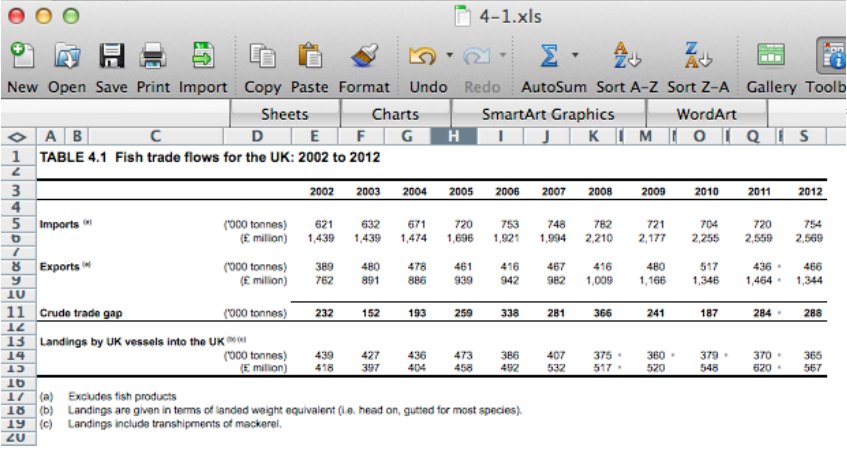
bad
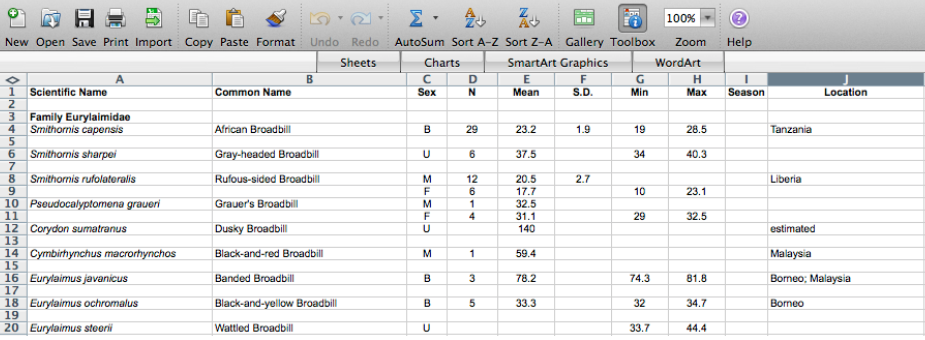
good
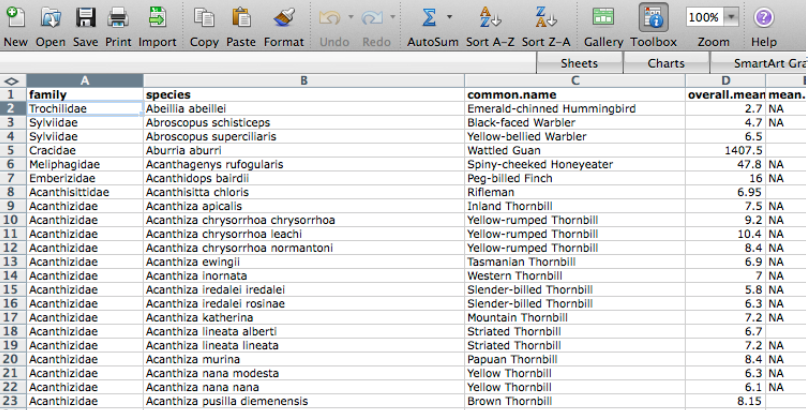
ok
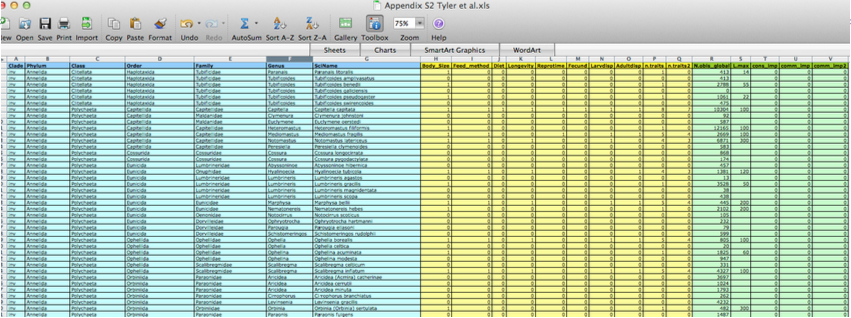
- could help data entry
.csvor.tsvcopy would need to be saved.
Basic quality control
Use good null values
Missing values are a fact of life
- Usually, best solution is to leave blank
NAorNULLare also good options- NEVER use
0. Avoid numbers like-999 - Don’t make up your own code for missing values
read.csv() utilities
na.string: character vector of values to be coded missing and replaced withNAto argument egstrip.white: Logical. ifTRUEstrips leading and trailing white space from unquoted character fieldsblank.lines.skip: Logical: ifTRUEblank lines in the input are ignored.fileEncoding: if you’re getting funny characters, you probably need to specify the correct encoding.
readr::read_csv() utilities
na: character vector of values to be coded missing and replaced withNAto argument egtrim_ws: Logical. ifTRUEstrips leading and trailing white space from unquoted character fieldscol_types: Allows for column data type specification. (see more)locale: controls things like the default time zone, encoding, decimal mark, big mark, and day/month namesskip: Number of lines to skip before reading data.n_max: Maximum number of records to read.
Inspect
Have a look at your data with View(df)
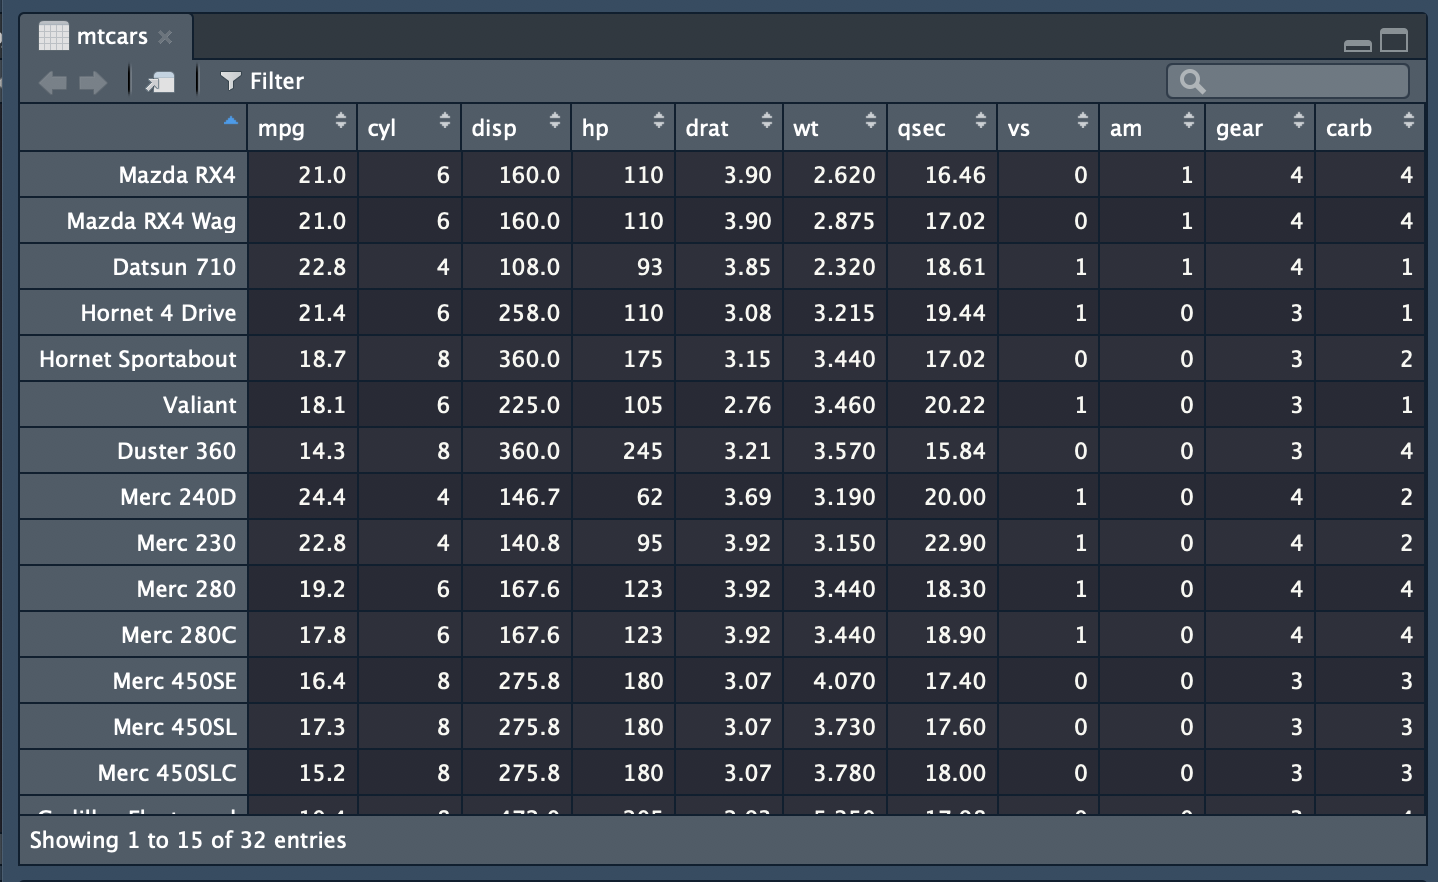
Check your software interprets your data correctly - eg see top few rows with head(df)
                   mpg cyl disp  hp drat    wt  qsec vs am gear carb
Mazda RX4         21.0   6  160 110 3.90 2.620 16.46  0  1    4    4
Mazda RX4 Wag     21.0   6  160 110 3.90 2.875 17.02  0  1    4    4
Datsun 710        22.8   4  108  93 3.85 2.320 18.61  1  1    4    1
Hornet 4 Drive    21.4   6  258 110 3.08 3.215 19.44  1  0    3    1
Hornet Sportabout 18.7   8  360 175 3.15 3.440 17.02  0  0    3    2
Valiant           18.1   6  225 105 2.76 3.460 20.22  1  0    3    1
Structure
see structure of any object with str().
'data.frame':   32 obs. of  11 variables:
 $ mpg : num  21 21 22.8 21.4 18.7 18.1 14.3 24.4 22.8 19.2 ...
 $ cyl : num  6 6 4 6 8 6 8 4 4 6 ...
 $ disp: num  160 160 108 258 360 ...
 $ hp  : num  110 110 93 110 175 105 245 62 95 123 ...
 $ drat: num  3.9 3.9 3.85 3.08 3.15 2.76 3.21 3.69 3.92 3.92 ...
 $ wt  : num  2.62 2.88 2.32 3.21 3.44 ...
 $ qsec: num  16.5 17 18.6 19.4 17 ...
 $ vs  : num  0 0 1 1 0 1 0 1 1 1 ...
 $ am  : num  1 1 1 0 0 0 0 0 0 0 ...
 $ gear: num  4 4 4 3 3 3 3 4 4 4 ...
 $ carb: num  4 4 1 1 2 1 4 2 2 4 ...
Summarise
- Check the range of values (and value types) in each column matches expectation.
- Check units of measurement are what you expect
      mpg             cyl             disp             hp
 Min.   :10.40   Min.   :4.000   Min.   : 71.1   Min.   : 52.0
 1st Qu.:15.43   1st Qu.:4.000   1st Qu.:120.8   1st Qu.: 96.5
 Median :19.20   Median :6.000   Median :196.3   Median :123.0
 Mean   :20.09   Mean   :6.188   Mean   :230.7   Mean   :146.7
 3rd Qu.:22.80   3rd Qu.:8.000   3rd Qu.:326.0   3rd Qu.:180.0
 Max.   :33.90   Max.   :8.000   Max.   :472.0   Max.   :335.0
      drat             wt             qsec             vs
 Min.   :2.760   Min.   :1.513   Min.   :14.50   Min.   :0.0000
 1st Qu.:3.080   1st Qu.:2.581   1st Qu.:16.89   1st Qu.:0.0000
 Median :3.695   Median :3.325   Median :17.71   Median :0.0000
 Mean   :3.597   Mean   :3.217   Mean   :17.85   Mean   :0.4375
 3rd Qu.:3.920   3rd Qu.:3.610   3rd Qu.:18.90   3rd Qu.:1.0000
 Max.   :4.930   Max.   :5.424   Max.   :22.90   Max.   :1.0000
       am              gear            carb
 Min.   :0.0000   Min.   :3.000   Min.   :1.000
 1st Qu.:0.0000   1st Qu.:3.000   1st Qu.:2.000
 Median :0.0000   Median :4.000   Median :2.000
 Mean   :0.4062   Mean   :3.688   Mean   :2.812
 3rd Qu.:1.0000   3rd Qu.:4.000   3rd Qu.:4.000
 Max.   :1.0000   Max.   :5.000   Max.   :8.000
pkg skimr
skimr provides a frictionless approach to displaying summary statistics the user can skim quickly to understand their data
| Name | trees |
| Number of rows | 31 |
| Number of columns | 3 |
| _______________________ | |
| Column type frequency: | |
| numeric | 3 |
| ________________________ | |
| Group variables | None |
Variable type: numeric
| skim_variable | n_missing | complete_rate | mean | sd | p0 | p25 | p50 | p75 | p100 | hist |
|---|---|---|---|---|---|---|---|---|---|---|
| Girth | 0 | 1 | 13.25 | 3.14 | 8.3 | 11.05 | 12.9 | 15.25 | 20.6 | ▃▇▃▅▁ |
| Height | 0 | 1 | 76.00 | 6.37 | 63.0 | 72.00 | 76.0 | 80.00 | 87.0 | ▃▃▆▇▃ |
| Volume | 0 | 1 | 30.17 | 16.44 | 10.2 | 19.40 | 24.2 | 37.30 | 77.0 | ▇▅▁▂▁ |
Validate
pkg assertr
The assertr package supplies a suite of functions designed to verify assumptions about data and can be used so detect data errors during analysis.
e.g confirm that mtcars:
has the columns “mpg”, “vs”, and “am”
contains more than 10 observations
column for ‘miles per gallon’ (mpg) is a positive number before further analysis
library(assertr)
library(dplyr)
mtcars |>
    verify(has_all_names("mpg", "vs", "am", "wt")) %>%
    verify(nrow(.) > 10) %>%
    verify(mpg > 0)
# A tibble: 32 × 11
mpg cyl disp hp drat wt qsec vs am gear carb
<dbl> <dbl> <dbl> <dbl> <dbl> <dbl> <dbl> <dbl> <dbl> <dbl> <dbl>
1 21 6 160 110 3.9 2.62 16.5 0 1 4 4
2 21 6 160 110 3.9 2.88 17.0 0 1 4 4
3 22.8 4 108 93 3.85 2.32 18.6 1 1 4 1
4 21.4 6 258 110 3.08 3.22 19.4 1 0 3 1
5 18.7 8 360 175 3.15 3.44 17.0 0 0 3 2
6 18.1 6 225 105 2.76 3.46 20.2 1 0 3 1
7 14.3 8 360 245 3.21 3.57 15.8 0 0 3 4
8 24.4 4 147. 62 3.69 3.19 20 1 0 4 2
9 22.8 4 141. 95 3.92 3.15 22.9 1 0 4 2
10 19.2 6 168. 123 3.92 3.44 18.3 1 0 4 4
# ℹ 22 more rowsData security
Raw data are sacrosanct
@tomjwebb don’t, not even with a barge pole, not for one second, touch or otherwise edit the raw data files. Do any manipulations in script
— Gavin Simpson (@ucfagls) January 16, 2015
@tomjwebb @srsupp Keep one or a few good master data files (per data collection of interest), and code your formatting with good annotation.
— Desiree Narango (@DLNarango) January 16, 2015
Aim for a clean, reproducible pipeline processing pipeline from raw to analytical data.
Give yourself less rope
It’s a good idea to revoke your own write permission to the raw data file.
Then you can’t accidentally edit it.
It also makes it harder to do manual edits in a moment of weakness, when you know you should just add a line to your data cleaning script.